
Recruiting Without Metrics Is Gut Feeling in Excel – TA KPIs: Essential and Sometimes Misleading
- Marcus

- May 10
- 6 min read

Talent Acquisition loves metrics. Time-to-Hire. Cost-per-Hire. Offer Acceptance Rate. Quality of Hire. Funnel Conversion. Source of Hire. Candidate Net Promoter Score (NPS). Open a modern recruiting dashboard today and you will often see more charts than in a CFO meeting.
The problem: many organizations measure a lot — but manage surprisingly little.
Because a KPI is not an insight. And certainly not a strategy.
Especially in Talent Acquisition, numbers quickly create the illusion of objectivity. Metrics appear precise. Neutral. Rational. In reality, recruiting KPIs are highly context-dependent. A low Time-to-Hire can indicate an excellent process. Or poor selection quality. A high application volume may point to strong employer branding. Or simply irrelevant traffic from job boards.
That is why the key question is not: “Which KPIs are we tracking?”It is: “Which decisions should improve because of these KPIs?”This is exactly where reporting separates from actual steering.
What Is a KPI, Really?
KPI stands for Key Performance Indicator — a metric used to measure the success of a process or activity. The crucial word here is “Key”. Not every number automatically qualifies as a KPI.
Many recruiting teams confuse reporting metrics with steering-relevant indicators. For example:
Number of applications = metric
Share of qualified applications = KPI
Interview-to-offer ratio = KPI
12-month retention = strategic KPI
A strong KPI fulfills several conditions:
It can be influenced
It has a clear business connection
It supports decision-making
It allows comparison over time
Ideally, it triggers concrete actions
Or more simply: if nobody knows what to do when the number looks bad, it is probably not a good KPI.
Why Recruiting KPIs Matter More Than Ever
The importance of KPIs in Talent Acquisition is increasing for several reasons.
Recruiting has become more expensive
Job advertising, active sourcing, recruiting technology, agencies, assessments, employer branding — companies now invest significant budgets into hiring processes. At the same time, HR and TA teams face growing pressure to justify these investments.
The labor market has become more complex
Many organizations recruit simultaneously in talent-shortage markets, high-volume environments, and international markets. Gut feeling scales surprisingly poorly in these settings.
AI and automation increase the expectation for data-driven steering
Organizations using AI in recruiting need reliable metrics. Otherwise, the machine simply optimizes the wrong things faster.
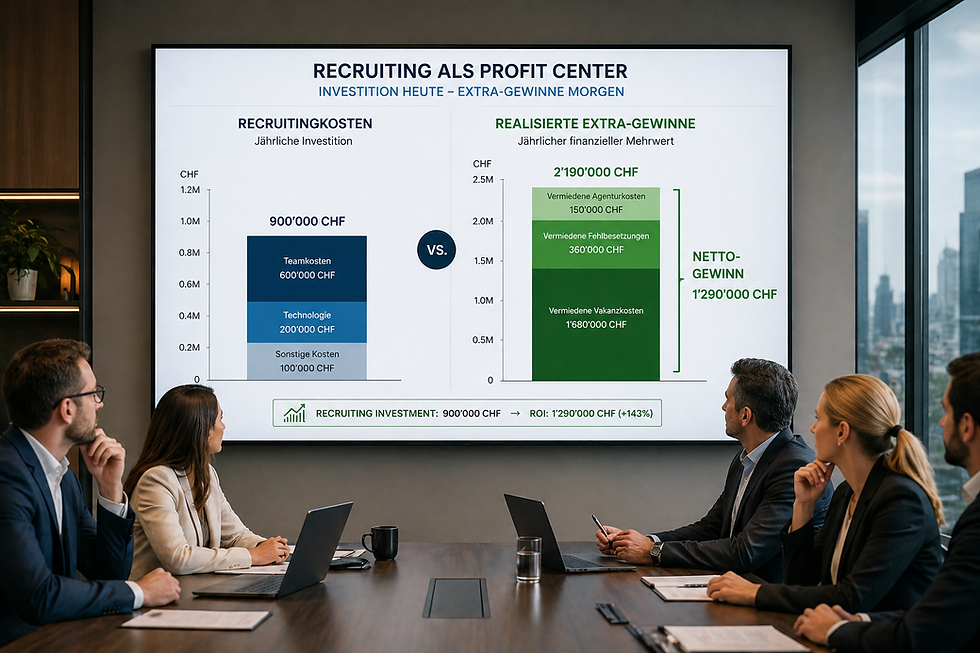
Executive leadership expects business impact instead of activity reports
“We posted 120 job ads” impresses leadership today roughly as much as “the office printer is working again”.
The Most Popular Recruiting KPIs — and What They Actually Tell You
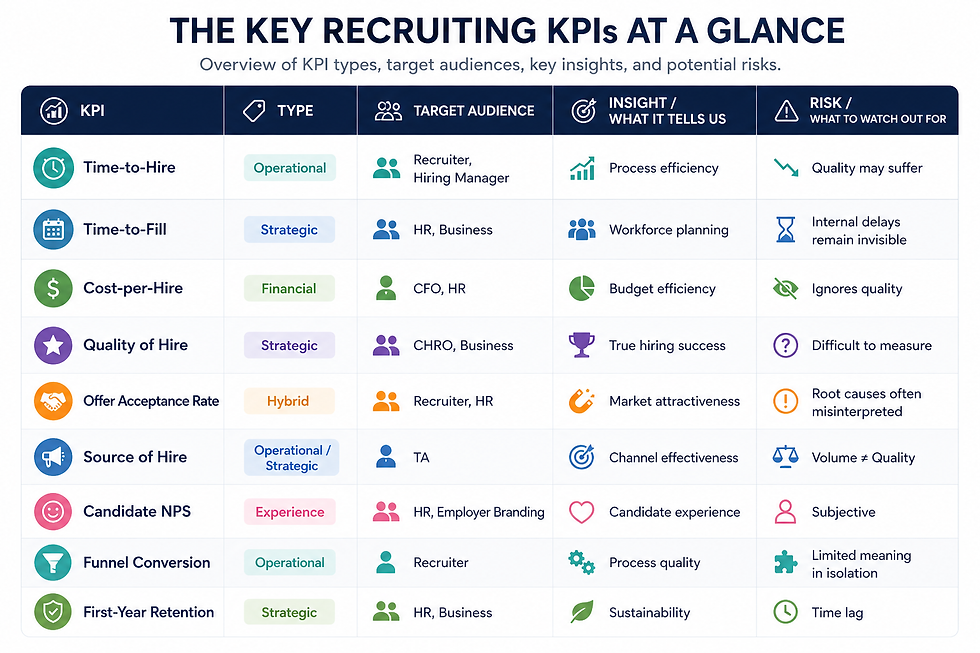
Time-to-Hire and Time-to-Fill
Probably the best-known recruiting KPIs.
The distinction is often used inconsistently:
Time-to-Hire = time from application to offer acceptance
Time-to-Fill = time from job approval to offer acceptance
Time-to-Fill is strategically more relevant because it reflects the entire process — including internal delays caused by approvals, hiring managers, or prioritization.
The problem: speed alone is not a quality indicator.
An extremely fast hiring process may indicate:
strong processes
a strong employer brand
efficient recruiters
Or:
low quality standards
rushed hiring decisions
weak selection rigor
That is why Time-to-Hire should almost never be viewed in isolation.
Cost-per-Hire
A classic finance KPI. It calculates the average cost per hire, including:
job advertising
recruiter costs
agencies
technology
assessments
employer branding
internal effort
Cost-per-Hire matters. But it is also dangerous. Because the KPI often ignores:
quality of hire
productivity of new employees
retention
opportunity costs of vacant positions
A cheap bad hire is rarely actually cheap.
Many companies aggressively optimize recruiting costs during cost-saving programs — while unintentionally increasing the costs of poor hiring decisions. When controllers run business decisions entirely through Excel, things can get… interesting.
Quality of Hire — the Most Important and Most Difficult KPI
Few recruiting metrics are discussed more frequently today. LinkedIn now describes Quality of Hire as one of the most important future metrics in recruiting.
The problem: almost nobody measures it consistently.
Because “quality” can mean many things:
performance after 12 months
goal achievement
retention
hiring manager satisfaction
cultural contribution
ramp-up speed
growth potential
That makes Quality of Hire less of a single KPI and more of a KPI cluster. This is exactly what makes the metric strategically valuable — and operationally difficult.
Interestingly, studies consistently show that recruiters increasingly rate Quality of Hire as more important than Cost-per-Hire. That makes sense. Recruiting creates business value not through fast hiring — but through good hiring.
Offer Acceptance Rate
A massively underestimated KPI. It measures the share of accepted offers.
The metric often provides surprisingly honest feedback about:
market competitiveness
compensation strategy
process quality
candidate experience
employer attractiveness
expectation management
Many organizations reflexively interpret a low Offer Acceptance Rate as a salary issue. In reality, the causes often emerge much earlier:
slow processes
poor communication
unclear role definitions
inconsistent interviews
weak candidate relationships
This KPI is particularly valuable because it reveals multiple process dimensions at the same time.
Source of Hire and Channel Effectiveness
One of the most misunderstood recruiting KPIs. Many companies only measure: “Where did the application come from?”
More strategically relevant questions would be:
Which channels generate hires?
Which channels generate good hires?
Which channels produce long-term successful employees?
Which channels work for which target audiences?
This is where major blind spots emerge.
Example: LinkedIn may generate a high number of hires. Referral recruiting, however, may produce significantly better retention rates.
Organizations that optimize purely for volume often do so at the expense of quality.
Candidate Experience KPIs
Candidate Experience is now measured far more systematically.
Typical KPIs include:
Candidate NPS
drop-off rate
response time
interview satisfaction
process duration per stage
Funnel data is particularly valuable because it often reveals exactly where candidates drop out of the process.
A classic recruiting misconception is: “High application numbers = good process.” Not necessarily.
A high drop-off rate in the application form may indicate:
poor mobile experience
overly complex processes
unclear communication
technical issues
lack of motivation
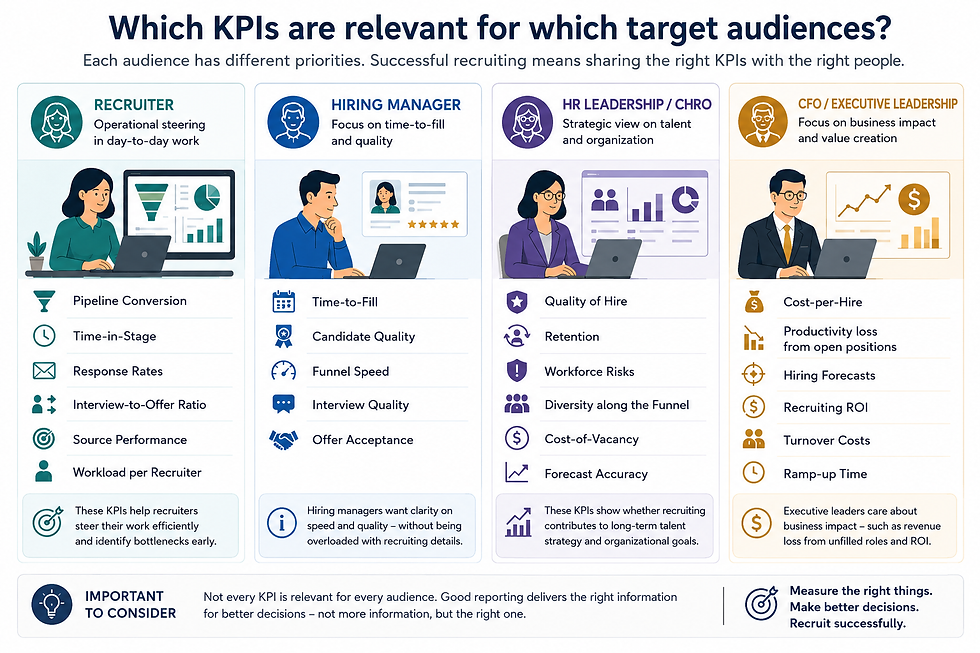
Which KPIs Matter for Which Stakeholders
Not every audience cares about the same metrics.
This is one of the most common mistakes in recruiting reporting: everyone sees the same dashboard.
Recruiters
Recruiters need operational steering metrics:
Pipeline Conversion
Time-in-Stage
Response Rates
Interview-to-Offer Ratio
Source Performance
Recruiter Workload
These KPIs directly support day-to-day recruiting execution.
Hiring Managers
Hiring managers primarily care about:
Time-to-Fill
Candidate Quality
Funnel Speed
Interview Quality
Offer Acceptance
Too many recruiting-specific detail metrics usually create confusion rather than clarity.
HR Leadership / CHRO
Strategic KPIs include:
Quality of Hire
Retention
Workforce Risks
Diversity throughout the funnel
Cost-of-Vacancy
Forecast Accuracy
CFO / Executive Leadership
This audience focuses on business outcomes:
Cost-per-Hire
productivity loss from vacancies
hiring forecasts
recruiting ROI
turnover costs
ramp-up time
The CFO rarely cares about “number of interviews”.But they care very much about revenue loss caused by unfilled positions.
The Biggest Risks of KPI-Driven Recruiting
KPIs are not neutral. They influence behavior. And this is where things become dangerous.
“What gets measured gets managed”
If recruiters are primarily measured on Time-to-Hire, organizations often see increases in:
hiring speed
risk of superficial selection
focus on easy-to-fill instead of difficult roles
If recruiters are optimized for number of hires:
consulting quality often declines
short-term thinking increases
candidate experience suffers
The KPI changes the system itself.
KPI Without Context = Dangerous False Precision
Benchmarking sounds objective. Often, it is not.
Example:
“Our Time-to-Hire is 38 days.” Is that good or bad? Without context, nobody knows.
Relevant factors include:
industry
seniority
labor market conditions
region
compensation level
skill availability
number of interview rounds
compliance requirements
Greenhouse explicitly points out that different roles require dramatically different hiring timelines. Yet many organizations still compare average values across completely different recruiting contexts. The result is often deeply flawed conclusions.
Which KPIs Truly Matter
The uncomfortable truth: there are no universally “correct” recruiting KPIs.
But there are better KPI systems.
Strong Talent Acquisition organizations typically combine four dimensions:
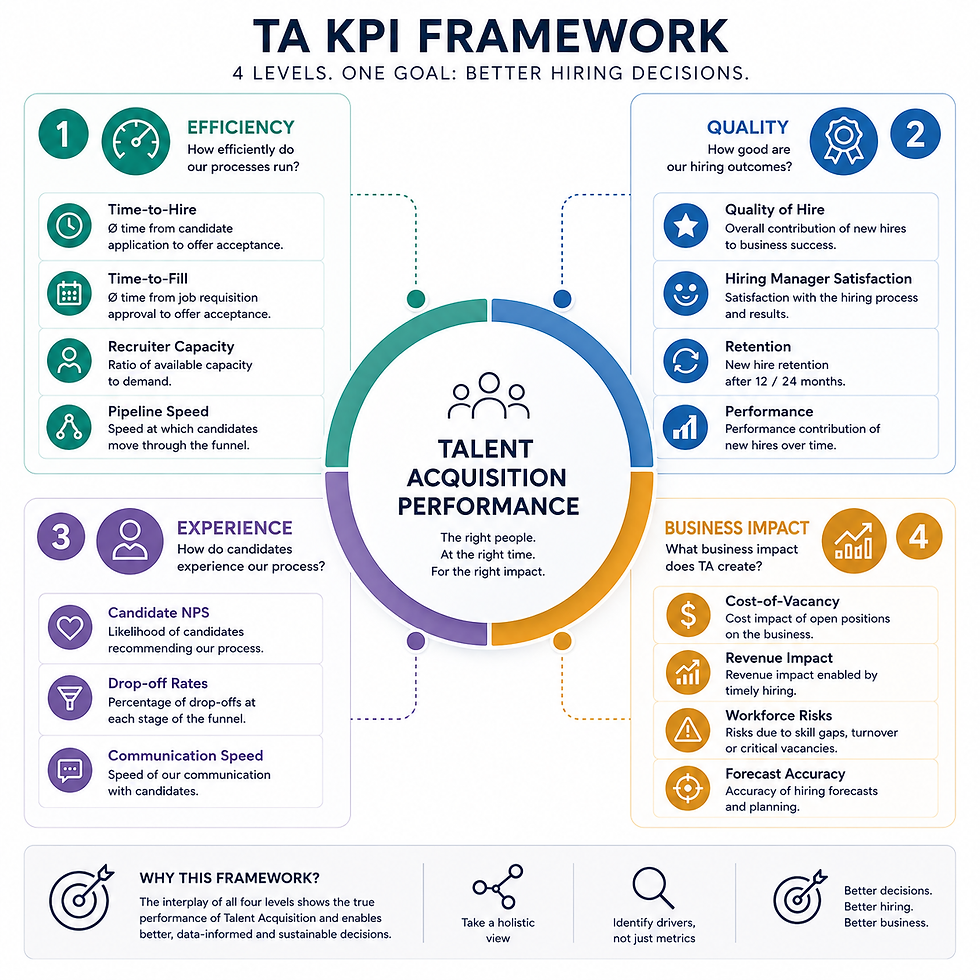
Only the combination of these dimensions makes recruiting truly steerable.
Why So Many Recruiting Dashboards Still Fail
Because they are often designed for reporting — not for decision-making. Most dashboards answer one main question: “What happened?”
Strategically relevant questions would instead be:
Why did it happen?
Which actions work?
Which risks are emerging?
Which trends are developing?
What do we need to change?
That is a fundamental difference.
Recruiting Is More Than Numbers
Recruiting KPIs should never become an end in themselves. They should enable better decisions. Nothing more. But also nothing less. Mature TA organizations therefore do not measure as much as possible. They measure intentionally. And they accept an uncomfortable reality: not everything that matters can be perfectly quantified.
The strongest recruiting factors often remain qualitative:
trust
relationships
interview quality
market understanding
credibility
candidate experience
leadership capability
KPIs can make these factors more visible. But they cannot replace them.
A recruiting dashboard is a navigation system. Not the car. And definitely not the driver.
Sources
AIHR – Recruiting Metrics Overview: https://www.aihr.com/blog/recruiting-metrics/
LinkedIn Talent Solutions – Quality of Hire: https://www.linkedin.com/business/talent/blog/quality-of-hire
LinkedIn – Candidate Experience Metrics: https://business.linkedin.com/hire/resources/talent-acquisition/metrics-to-measure-candidate-experience
Greenhouse – Strategic Recruiting KPIs: https://www.greenhouse.com/blog/4-strategic-recruiting-kpis-and-talent-acquisition-metrics
Greenhouse – Recruiting Benchmarks 2026: https://www.greenhouse.com/recruiting-benchmarks
Kienbaum – Time-to-Hire vs. Time-to-Fill: https://www.kienbaum.com/glossar/time-to-hire-time-to-fill/
Workable – Recruiting KPI Guide: https://resources.workable.com/tutorial/recruiting-kpis
Survale / Jobvite Data on Quality of Hire: https://survale.com/correct-quality-of-hire-metrics/
Greenhouse – KPI ABCs: https://www.greenhouse.com/guidance/recruiting-metrics-abcs-the-ultimate-list-of-the-recruiting-metrics-that-matter


Comments